Juggling the Chaos as a COPD Caregiver
The goal of this project was to analyze seven days worth of self-reported data from caregivers supporting one or more people living with Chronic Obstructive Pulmonary Disease (COPD). Communication design is an important asset in portraying the challenges and opportunities of a journey. By using models and visual forms of storytelling findings are delivered effectively framing the data and informing design solutions to improve experiences.
This is a summary of the communication design work completed over a 6 week period.
Healthcare Design
Individual work
Advisor
Kim Erwin
STRUCTURING THE DATA: MAKING SENSE OF SELF REPORTED DATA
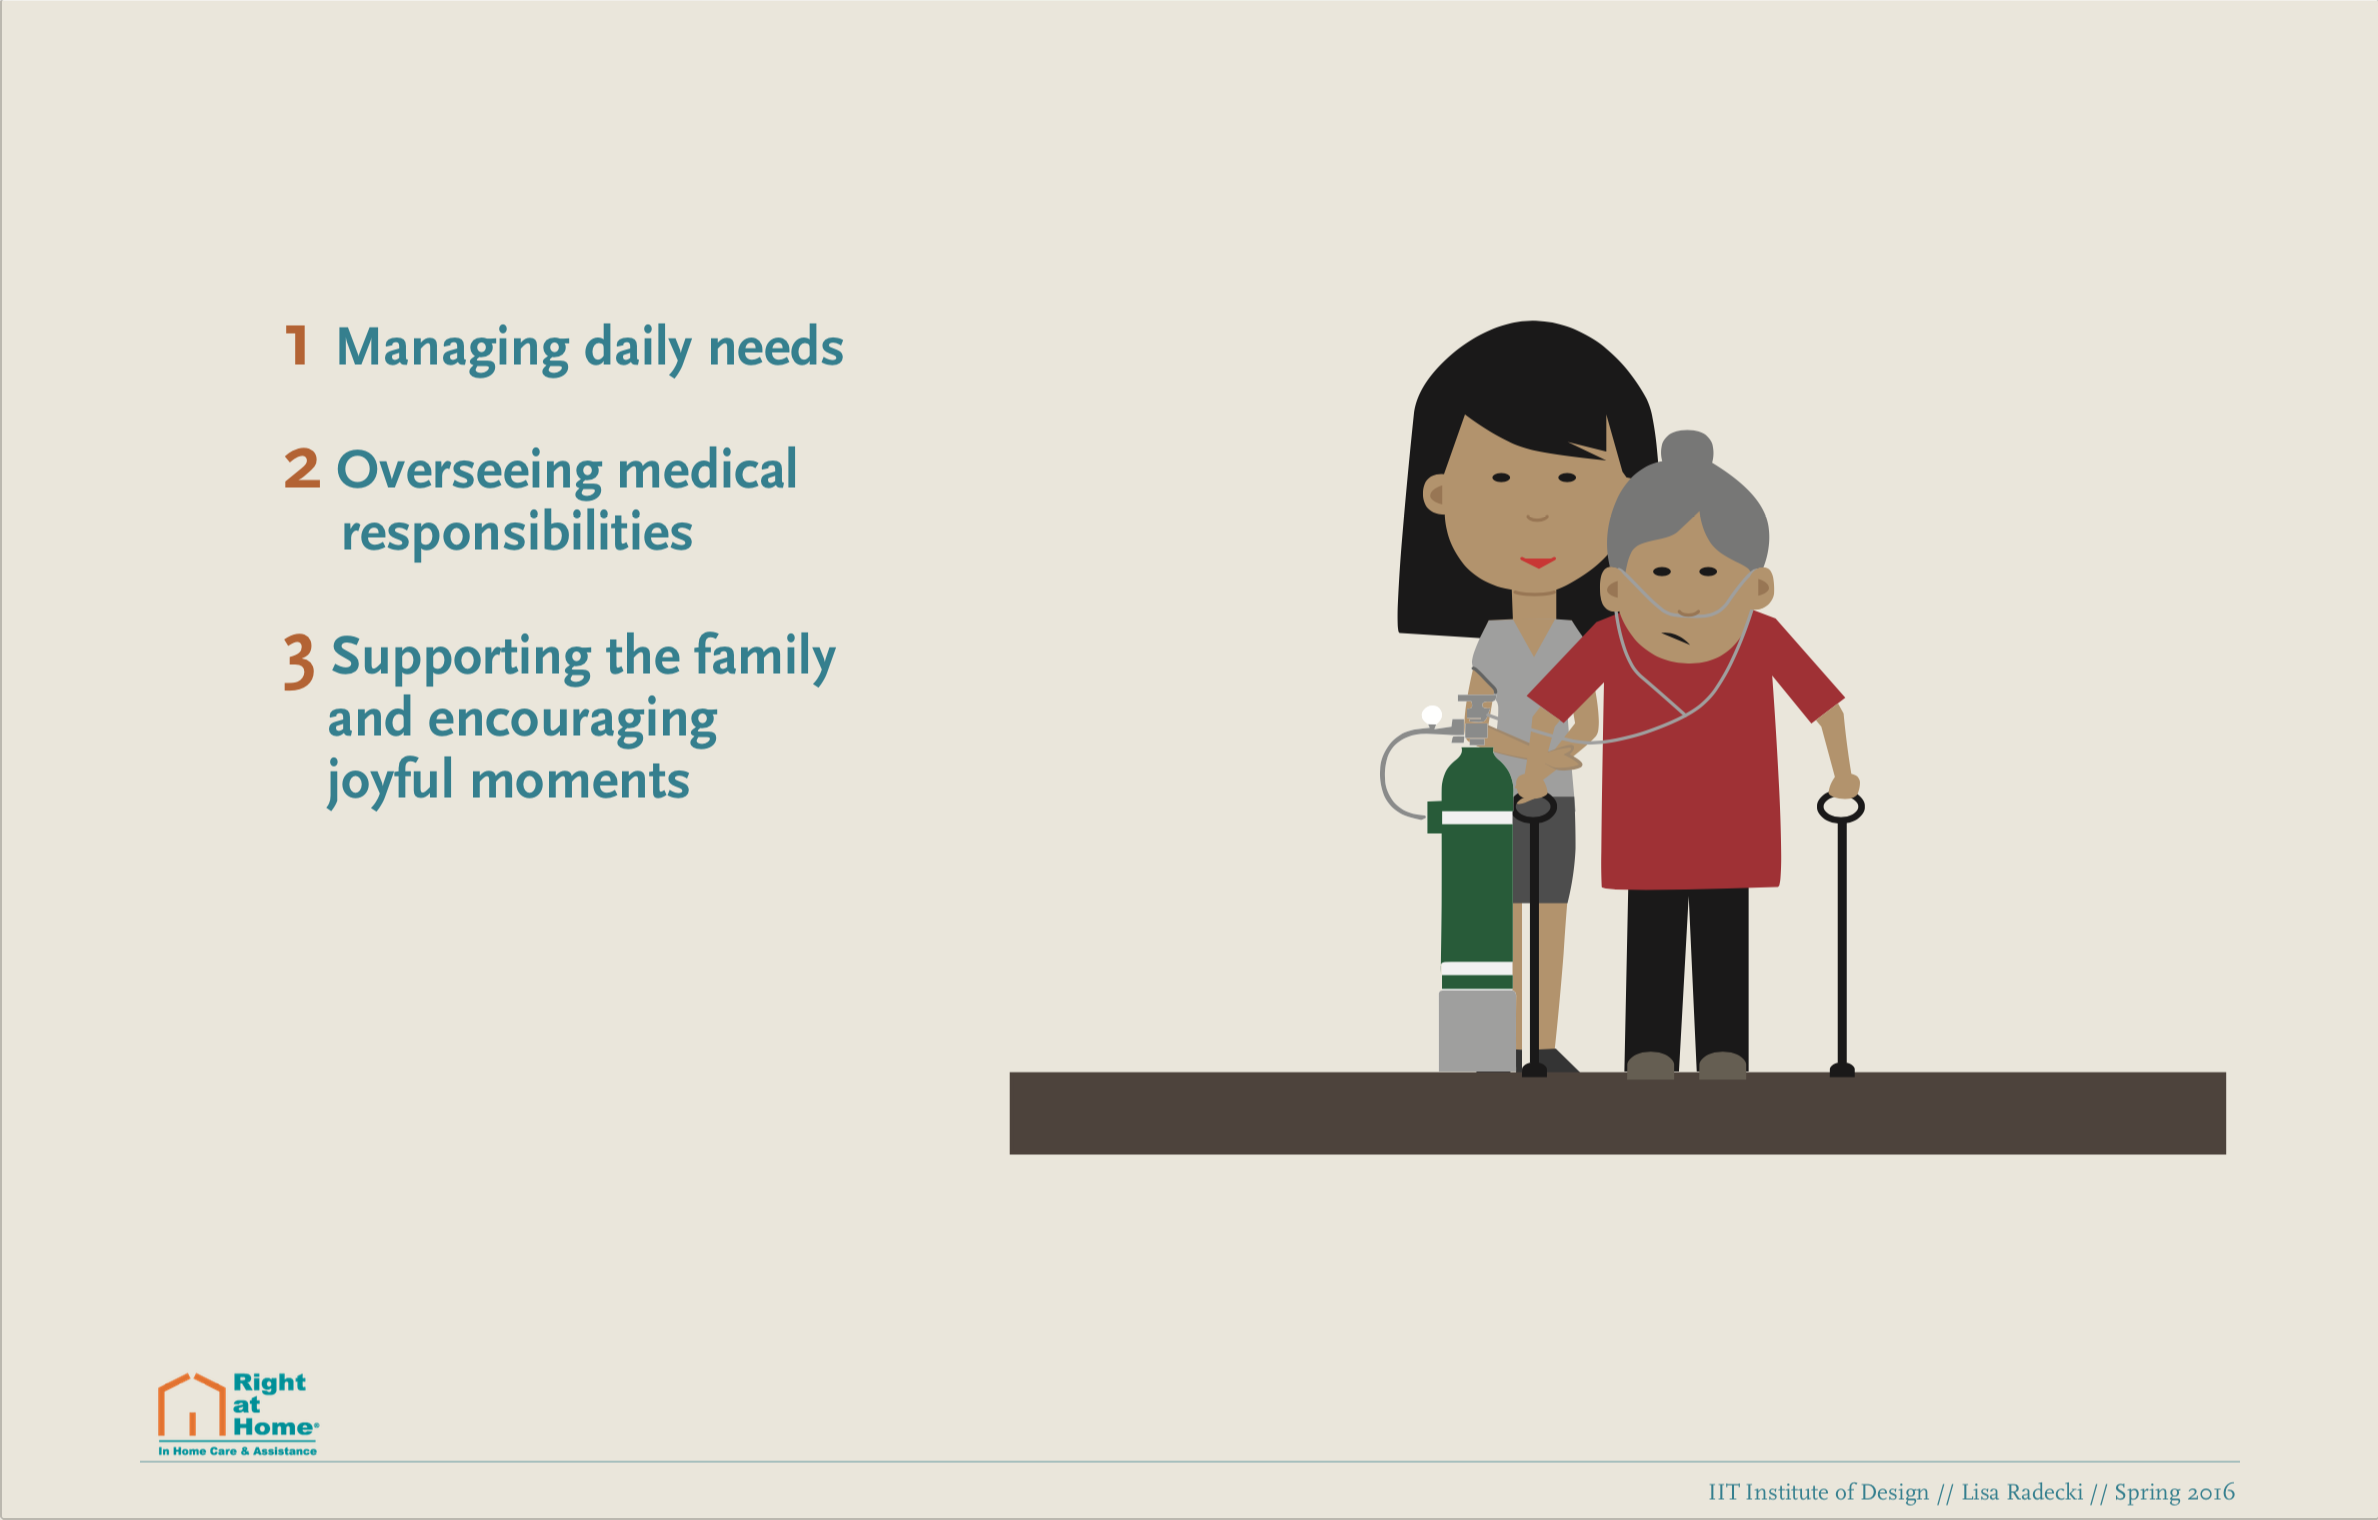
10 COPD caregivers self-reported their daily routines for seven days by documenting their day to day tasks around COPD care through photography and answering a set of survey questions. The data was then coded using the “Quad 4” framework (activities, attitudes, ambitions, and anxieties) as a way to structure the mess.


MODELING THE DATA: FIND RELATIONS AMONG INFORMATION
The purpose of the model is to take the structured data and visually represent it to allow individuals to quickly grasp the information and insights. The patterns that emerge from the data show relations between multiple caregivers with similar challenges.

STORY PLATFORM
The story platform is designed to draw the attention of the stakeholders by captivating them with visual cues, quotes, and insights on the chaos as a COPD caregiver. Through a visual representation individuals outside of the program can understand the narrative and the challenges involved in a caregiver’s life.

Click to Enlarge - Original format: 36" x 22" poster
NEW SERVICE NARRATIVE
Building a narrative around peoples experiences illustrates the challenges people have, which helps create empathy and understanding. In healthcare we must acknowledge that it is not only the patients journey, but also clinicians, caregivers, and people behind the scenes who impact and interact with new designs. A sustainable design is required to address the needs and expectations of all parties to be a success.